📊 Full opportunity report: The Stanford AI Index 2026 Audit: Reading the Field’s Annual Report Card With a Critic’s Pen on ThorstenMeyerAI.com — validation score, market gap, and execution plan.
TL;DR
The Stanford AI Index 2026 has been released, providing a comprehensive but partial snapshot of AI progress and policy trends. This article evaluates its strengths, limitations, and significance for the AI community and policymakers.
The Stanford AI Index 2026, the most-cited annual report on artificial intelligence, was published three weeks ago. This analysis examines its methodology, reliability, and the implications of its findings for policymakers, industry, and academia. While the Index provides valuable benchmarks and policy tracking, its interpretive claims require careful scrutiny given inherent limitations.
The 2026 edition of the Stanford AI Index spans over 400 pages, covering research, technical performance, economy, responsible AI, and public opinion. It is regarded as a key reference point for AI progress, influencing policy and media narratives worldwide. The report is particularly rigorous in measuring benchmark performance, transparency, and policy activity, with traceable data sources and transparent methodology.
However, the Index admits to certain limits, notably in areas like workforce impact, public sentiment, and consumer value, where data is less reliable or more interpretive. Its coverage across jurisdictions is comprehensive, tracking laws, investments, and regulatory developments globally. Critics caution that the Index’s interpretive claims should be read with skepticism, emphasizing facts over conclusions.
Reading the report card with a critic’s pen.
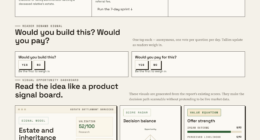
The Index is rigorous on what it counts and interpretive on what it summarizes. Both descriptions are accurate.
The Stanford AI Index 2026 is the most cited annual document on AI. 400+ pages, 9th edition, 11 chapters. The Foundation Model Transparency Index dropped 58 → 40 in one year. The Index can only measure what gets disclosed. The audit identifies where to anchor on counted facts, where to discount the interpretive claims, and how to read the document with appropriate skepticism.
Where the Index is rigorous. Where the Index is interpretive.
The Index is most rigorous on what it counts (publications, models, dollars, policies, benchmark scores). It is least rigorous on what it interprets (consumer value, workforce impact, public sentiment). Anchor on counted facts. Treat interpretive claims with proportionate skepticism.

The Ph.D. Research Blueprint: A Complete Guide to Research Methodology, Academic Writing, AI Tools, UGC Guidelines, and Publication Strategies
As an affiliate, we earn on qualifying purchases.
As an affiliate, we earn on qualifying purchases.
Benchmarks saturate faster than they’re constructed.
The Index reports benchmarks at the moment of saturation — by which time the benchmark has lost most of its discriminating power. The benchmarks the 2026 Index reports are running out of useful signal even as they are being published. The 2027 Index will need new benchmarks the 2026 frontier doesn’t saturate.

The future of European competitiveness: Part B: In-depth analysis and recommendations
As an affiliate, we earn on qualifying purchases.
As an affiliate, we earn on qualifying purchases.
Five reliable. Five fragile.
Specific numbers from the 2026 Index that should be quoted directly versus quoted only with explicit confidence intervals. The same Index produces both kinds of finding. Distinguishing them is the audit’s central practical contribution.
- FMTI 58→40 YoYIndex’s own measurement of explicit construct. Documented methodology. Trend unambiguous.
- Arena Elo top tierAnthropic 1503, xAI 1495, Google 1494, OpenAI 1481. Standardized methodology. Quote directly.
- Closed-vs-open gap 3.3%Up from 0.5% in Aug 2024. Precise measurement of structural shift. Open-vs-closed inflection.
- Robots 12% household tasksMost underappreciated number in entire Index. Concrete physical-world gap.
- Apollo Go 11M rides +175% YoYPublic-record disclosure. Clean methodology. Chinese AV scale underreported.
- $172B “consumer value”Willingness-to-pay survey data. Real CI: ~$50–300B. Quote trend, not level.
- 53% global adoption in 3 yearsIncludes any-use-ever. Sustained use ~20–30%. Clarify the definition.
- Median value tripled ’25-’26Same WTP methodology. Probably 1.5–4×. Direction reliable, magnitude not.
- US ranks 24th at 28.3%Trial-vs-sustained sensitivity. Rank > absolute %.
- “Hits young workers first”Multiple alternative explanations. Treat as correlation, not causation.
The Index’s authority creates the obligation to audit it. The audit produces a more useful document, not a less useful one.

NextGen Tech Breakdown – AI Tools, GPU Benchmarks & Web Performance Experiments
As an affiliate, we earn on qualifying purchases.
As an affiliate, we earn on qualifying purchases.
Four assignments. By role.
Read the methodology appendix first.
Even if you cited prior editions, the 2026 has more rigor on some numbers and more interpretive freedom on others. Quote rigorous numbers directly. Caveat interpretive numbers. Acknowledge the Index’s own self-criticism in your citation. Stanford HAI’s authority comes partly from its self-criticism — preserving that in citation chains preserves the authority.
Use the FMTI drop as institutional pressure.
The 58 → 40 transparency drop is the field’s primary authoritative scoreboard saying you disclose less than you used to. Visibility in the Index — and the framing capture that comes with it — depends on willingness to disclose. Labs that publish more methodology capture more positive framing. Labs that publish less become invisible to the document that policymakers read.
Calibrate use to category gradations.
Policy chapter is most rigorous and most directly actionable. Public-opinion chapter most subject to framing effects. FMTI is the single most important methodological signal. Do not quote consumer-value dollar figure as a fact; quote the trend instead. Read policy + transparency carefully. Read public-opinion with skepticism.
Use the Index as starting point, not citation chain endpoint.
Read the methodology appendix before any chapter. The science and medicine chapter framings are unusually critical and worth integrating into your own work. Treat “notable models” geographic distribution as curated rather than complete picture. Underlying source surveys and labor-market studies are the real citation chain.

AI for Game Developers: The 2025 Practical Guide
As an affiliate, we earn on qualifying purchases.
As an affiliate, we earn on qualifying purchases.
Impact of the Index on AI Policy and Research
The Stanford AI Index 2026 shapes global AI discourse by providing a widely-cited, data-driven snapshot of the field’s progress. Its rigorous benchmarking influences investment, regulation, and scientific priorities. However, reliance on its interpretive claims without critical review could lead to misinformed decisions, making awareness of its methodological limits essential for policymakers and industry leaders.
Background and Evolution of the AI Index
The Stanford AI Index, now in its ninth edition, has grown in scope and influence since its inception, becoming a central reference for AI progress. Previous editions focused on performance benchmarks, model transparency, and policy tracking. The 2026 report continues this trend, integrating new data sources and expanding its policy analysis to include over 30 jurisdictions. Its methodology emphasizes traceability and transparency, but critics note that some interpretive areas remain less rigorous.
“The Index’s benchmark performance tracking is highly rigorous, providing a reliable measure of AI capabilities across multiple domains.”
— Thorsten Meyer, author of the report
Limitations and Challenges in Data Interpretation
While the Index excels at measuring concrete metrics like benchmark scores and policy activity, it is less reliable in areas such as workforce impact, public sentiment, and consumer value. Its interpretive claims in these domains are based on less direct data and are subject to debate. The methodology appendix clarifies these limitations, but some readers may overstate the certainty of these conclusions.
Future Updates and Critical Engagement with the Index
The next edition of the Stanford AI Index is expected in 2027, with potential improvements in data coverage and methodology. Policymakers, researchers, and industry leaders should continue to critically evaluate the Index’s findings, especially in interpretive areas. Further transparency in methodology and expanded data sources could enhance its reliability and influence.
Key Questions
What are the main strengths of the Stanford AI Index 2026?
The Index’s strengths include rigorous benchmarking, transparent methodology, comprehensive policy tracking, and honest acknowledgment of its limitations, making it a reliable reference for technical progress and policy trends.
In which areas should readers be cautious when interpreting the Index?
Readers should approach claims related to workforce impact, public sentiment, and consumer value with caution, as these areas rely on less direct data and are more interpretive.
How does the Index influence AI policy and investment?
By providing authoritative data on AI progress and regulation, the Index informs policymaker decisions, industry investments, and media narratives, shaping the global AI landscape.
What are the limitations of the Index’s methodology?
The Index is less rigorous in interpretive areas such as societal impact, workforce displacement, and consumer benefits, where data is less concrete and more susceptible to bias or misinterpretation.
What should stakeholders look for in future editions?
Stakeholders should seek improvements in data transparency, expanded coverage of societal impacts, and clearer differentiation between measured facts and interpretive claims.
Source: ThorstenMeyerAI.com