
To find causes with a Fishbone Diagram, start by clearly defining the problem at the head of the diagram. Then, brainstorm potential causes and organize them into main categories like people, processes, equipment, or environment. Use the diagram’s branching structure to explore each area thoroughly, asking “why” repeatedly to uncover root causes. Keep refining your causes through team input and prioritization, and you’ll uncover deeper insights that lead to effective solutions—more details await as you explore further.
Key Takeaways
- Brainstorm potential causes within main categories like people, processes, equipment, and environment.
- Use the “5 Whys” technique to delve deeper into each cause for root identification.
- Collaborate with team members to gather diverse perspectives and uncover overlooked causes.
- Prioritize causes based on their impact and likelihood to focus on the most significant issues.
- Continuously update and refine the diagram as new causes emerge or more information becomes available.
Ever wondered how to identify the root causes of a problem systematically? The Fishbone Diagram, also known as the Ishikawa diagram, is a powerful tool that can help you do exactly that. When tackling complex issues, it’s easy to get overwhelmed by surface-level symptoms. The Fishbone Diagram guides your problem analysis by breaking down potential causes into organized categories, making it easier to see where the true issues lie. This visual approach encourages you to think holistically about the problem, guaranteeing you don’t miss underlying factors that contribute to the situation.
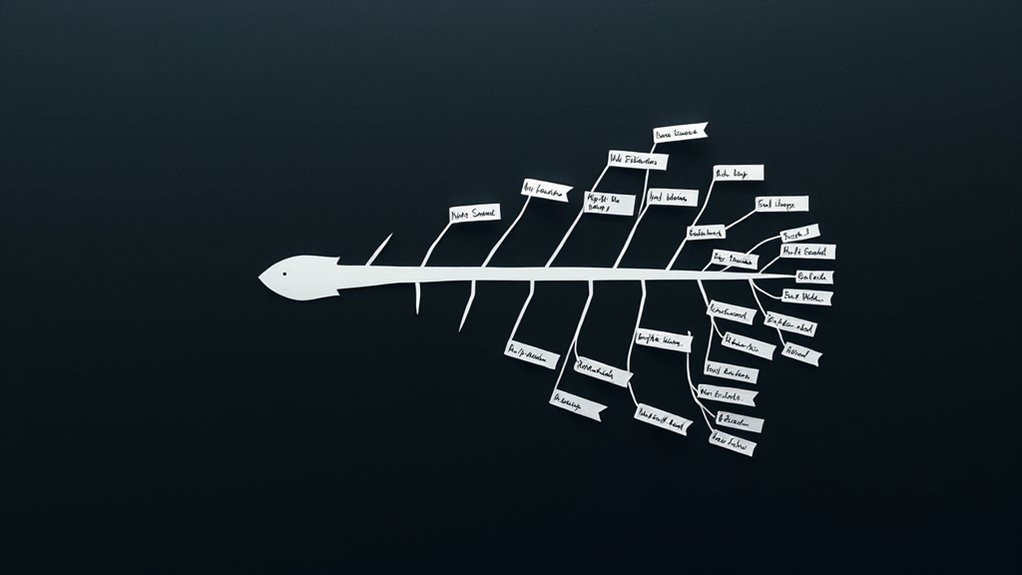
To start, you draw a horizontal line, or the “fish’s backbone,” with the problem you’re analyzing written at the head. From there, you create branches that resemble fishbones extending from the spine. These branches represent the main categories of potential root causes, such as people, processes, equipment, materials, environment, and management. By categorizing causes in this way, you systematically explore each aspect that could contribute to the problem. This structured problem analysis helps you avoid jumping to conclusions and instead focus on all possible factors.
Start by drawing a line with the problem at the head, then add branches for categories like people, processes, and equipment.
As you brainstorm causes within each category, you keep asking yourself “why” repeatedly. This iterative questioning reveals deeper layers of causes, guiding you toward the root causes rather than just surface issues. For example, if you notice a process delay, you might ask why it occurs. The answer might be because of outdated procedures, which leads you to examine the process workflows more closely. This methodical approach guarantees that your problem analysis digs into the core of the issue, rather than settling on superficial explanations. Incorporating knowledge of aromatherapy techniques can also help you manage stress or tension that might be contributing to the problem.
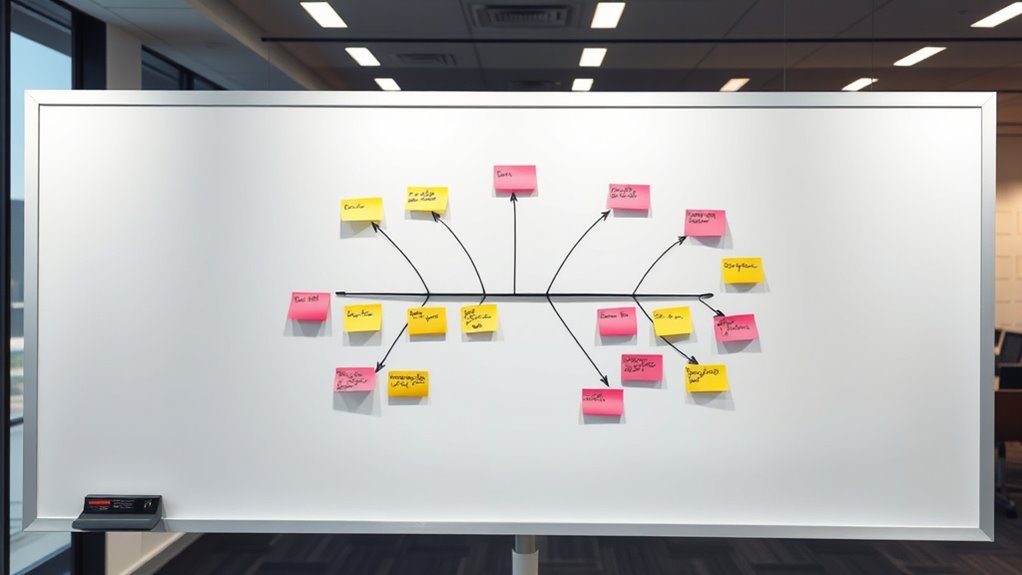
The Fishbone Diagram also fosters collaboration, encouraging team members to contribute their insights. Sometimes, others might see causes that you’ve overlooked or suggest different perspectives, enriching your problem analysis. As causes are identified, you can prioritize which ones to address based on their impact and likelihood, making your problem-solving efforts more effective.
Using the Fishbone Diagram isn’t a one-time activity; it’s an ongoing process that helps you continually refine your understanding of complex problems. It provides clarity in chaos by visually laying out causes and connections. When you apply this technique consistently, it enhances your ability to identify root causes efficiently, leading to more targeted solutions. Ultimately, the Fishbone Diagram transforms a challenging problem into a manageable set of causes, empowering you to make well-informed decisions and implement effective improvements.
Fishbone Diagram whiteboard kit
As an affiliate, we earn on qualifying purchases.
As an affiliate, we earn on qualifying purchases.
Frequently Asked Questions
How Do I Prioritize Causes Identified in the Fishbone Diagram?
To prioritize causes from your fishbone diagram, start with cause ranking based on impact and likelihood. Use prioritization techniques like the Pareto principle or weighted scoring to identify the most critical causes. Focus on causes that considerably contribute to the problem and are feasible to address first. This approach helps you efficiently allocate resources and tackle issues that will make the biggest difference, ensuring effective problem-solving.
Can Fishbone Diagrams Be Used for Qualitative Analysis?
Sure, you can use fishbone diagrams for qualitative insights, turning them into a detective’s magnifying glass for subjective assessment. Imagine painstakingly tracing the shadows of opinions and feelings instead of hard data—it’s like analyzing the scent of a mystery. While not ideal for quantitative data, they help you explore root causes through storytelling, capturing nuance and context that numbers often miss. So, yes, they’re surprisingly versatile for qualitative analysis.
What Tools Complement Fishbone Diagrams for Root Cause Analysis?
You can complement fishbone diagrams with statistical tools like Pareto charts and scatter plots to identify patterns and prioritize causes. Data visualization techniques help you see trends and relationships more clearly, making root cause analysis more effective. By combining these tools, you get a thorough view of the problem, enabling you to target the most impactful causes and develop better solutions.
How Often Should a Fishbone Diagram Be Updated in a Project?
You should update your fishbone diagram regularly, ideally following a revision schedule aligned with project milestones. For example, during a manufacturing process improvement, updating the diagram after each phase guarantees you capture new insights and emerging causes. Typically, a bi-weekly or monthly frequency updates work well, especially when the project evolves rapidly. Consistent reviews help keep the diagram accurate and relevant, guiding effective root cause analysis throughout your project.
Are Fishbone Diagrams Suitable for Complex Multi-Layered Problems?
Yes, fishbone diagrams are suitable for complex multilayered problems. You can use layered analysis to break down each issue into smaller, manageable parts, helping you identify root causes across various levels. By visualizing different contributing factors, you clarify multilayer complexity and better address each layer systematically. This approach enhances your understanding, ensuring no critical cause is overlooked, and improves your problem-solving effectiveness in complex scenarios.
cause and effect diagram poster
As an affiliate, we earn on qualifying purchases.
As an affiliate, we earn on qualifying purchases.
Conclusion
By mastering the fishbone diagram, you unlock the power to pinpoint causes faster than a lightning strike. This tool transforms complex problems into clear, actionable insights, making you a problem-solving superhero. Don’t let issues overwhelm you—use the Ishikawa method to uncover root causes with laser focus. With this technique, you’ll tackle challenges so effectively, they’ll seem like minor sparks compared to the blazing solutions you’ll ignite. Get ready to conquer any problem that comes your way!
team brainstorming flip chart
As an affiliate, we earn on qualifying purchases.
As an affiliate, we earn on qualifying purchases.
root cause analysis software
As an affiliate, we earn on qualifying purchases.
As an affiliate, we earn on qualifying purchases.