
As a leader, you need executive dashboards that provide instant, visual insights into your key performance metrics. These dashboards allow you to quickly spot trends, outliers, and areas needing attention without waiting for manual reports. Customizable and interactive, they help you focus on what matters most and act swiftly. By transforming complex data into clear visuals, dashboards empower smarter decisions—exploring further reveals how to leverage these tools for organizational success.
Key Takeaways
- Provide real-time, centralized insights into key performance indicators (KPIs) for quick decision-making.
- Use data visualization techniques like charts and heat maps to simplify complex data.
- Offer customization and interactivity to focus on relevant metrics and enable in-depth analysis.
- Support proactive management with instant visibility and AI-powered trend identification.
- Enhance strategic focus by translating data into intuitive visuals aligned with organizational goals.

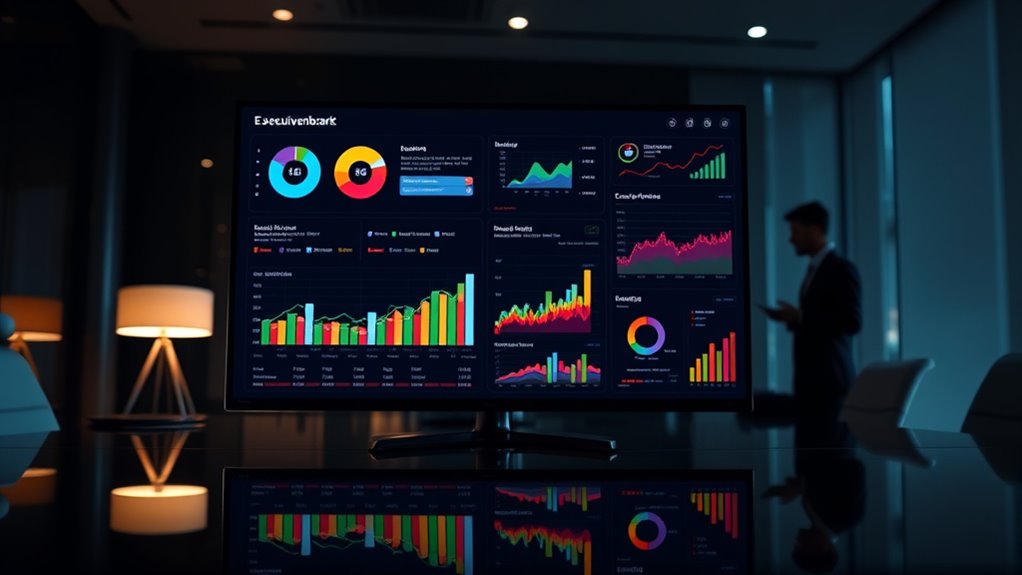
Executive dashboards provide a centralized platform for quick insights into a company’s key performance indicators (KPIs). When you’re looking to make informed decisions swiftly, these dashboards become crucial tools that consolidate critical data into a single, accessible view. They serve as your command center, giving you a real-time snapshot of how your organization is performing across various metrics. This immediacy allows you to respond proactively to emerging issues or opportunities without sifting through multiple reports or data sources. The power of effective dashboards lies in their ability to use data visualization techniques that transform raw numbers into meaningful, easy-to-understand visuals. Charts, graphs, gauges, and heat maps make complex data more digestible, helping you grasp trends, outliers, and patterns at a glance. This visual clarity supports KPI tracking, enabling you to monitor progress toward strategic goals constantly. Whether it’s sales figures, customer satisfaction scores, or operational efficiency metrics, you can see how each KPI measures up against targets in real time. With this instant visibility, you avoid delays caused by manual data collection or report generation, making your decision-making more agile and data-driven. Additionally, integration of AI-powered analysis can further enhance your ability to identify patterns and trends, supporting even more proactive management.
Furthermore, executive dashboards are customizable, so you can tailor what information you see based on your specific priorities. If sales growth is your focus, you’ll have a dedicated view highlighting sales KPIs, conversion rates, and pipeline health. If operational efficiency matters more, relevant metrics like cycle times, resource utilization, or defect rates can be front and center. This personalization ensures that you’re always viewing the most relevant data without distraction. Many dashboards also incorporate interactive elements, allowing you to drill down into details or filter data based on time periods, regions, or departments. Such features make KPI tracking more dynamic and insightful, giving you the ability to explore underlying factors affecting performance.
In the end, the goal of executive dashboards is to empower you with clear, concise, and actionable information. When data visualization is used effectively, it transforms complex datasets into intuitive visuals that support quick comprehension. This capability is indispensable for leaders who need to stay on top of multiple facets of their organization simultaneously. By streamlining data access and enhancing KPI tracking, dashboards enable you to focus on strategic initiatives rather than data collection, ensuring you stay ahead in a competitive environment. Ultimately, leveraging these tools helps you make smarter decisions faster, driving your organization toward sustained success.
Frequently Asked Questions
How Do Dashboards Adapt to Different Leadership Styles?
You can adapt dashboards to different leadership styles through customization, aligning data visualization with your leadership preferences. For example, if you’re detail-oriented, you might prefer granular metrics, while a big-picture leader might focus on high-level summaries. By customizing dashboards, you guarantee the information is relevant and accessible, helping you make informed decisions quickly and effectively, no matter your leadership style.
What Security Measures Protect Sensitive Dashboard Data?
Did you know that over 80% of data breaches target sensitive information? To protect dashboard data, you should implement strict access controls, ensuring only authorized personnel can view or modify information. Additionally, data encryption safeguards data both at rest and in transit, making it unreadable to hackers. These security measures work together to keep your sensitive dashboard data secure, giving you peace of mind and maintaining trust with stakeholders.
Can Dashboards Integrate Real-Time Data From Multiple Sources?
Yes, dashboards can incorporate real-time data from multiple sources through real-time integration, enabling you to access the latest information instantly. This process relies on data synchronization, which keeps data consistent across all platforms. By setting up seamless connections, you guarantee your dashboard updates automatically as new data arrives, giving you timely insights and enabling quick, informed decisions without manual intervention.
How Often Should Executive Dashboards Be Updated?
You should update executive dashboards based on your organization’s needs and the dashboard customization you’ve implemented. Typically, a daily or real-time update frequency works best for operational insights, ensuring data remains current. For strategic or longer-term decisions, weekly or monthly updates may suffice. Adjust the update frequency to balance timely data with the system’s performance, ensuring you always have relevant, accurate information to make informed decisions.
What Training Is Needed to Interpret Complex Dashboards Effectively?
You need targeted user training to interpret complex dashboards effectively, especially with customizations in place. When you learn how to navigate dashboard customization, you’ll spot trends faster and make better decisions. Focus on understanding key metrics and visualizations through hands-on workshops or online courses. This way, you’ll gain confidence and maximize your dashboard’s potential, turning data into actionable insights without feeling overwhelmed by complexity.
Conclusion
Remember, dashboards are your eyes into your business—yet they’re only as good as the insights they deliver. While data can seem overwhelming, a well-designed executive dashboard simplifies complexity into clarity. It’s the difference between flying blind and steering with precision. Embrace these tools, and you’ll turn raw numbers into strategic decisions—guiding your organization confidently forward. In a world of chaos, your dashboard becomes your calm, your compass, your competitive edge.