📊 Full opportunity report: Bitcoin Battles Unfold in Live Warzone Visualization on ThorstenMeyerAI.com — validation score, market gap, and execution plan.
TL;DR
A new web-based project visualizes Bitcoin trading as a cinematic battlefield, showing live market activity as combat. It connects directly to Binance and Coinbase streams, offering an immersive experience without backend infrastructure. This innovative display highlights market volatility and activity in real-time.
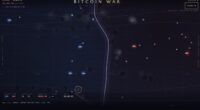
isbitcoindead.com has launched a live, browser-based visualization that transforms real-time Bitcoin (BTC/USDT) trades into an ongoing cinematic battlefield. This innovative tool offers viewers a dynamic depiction of market activity, illustrating the relentless tug-of-war between buyers and sellers. The project is accessible instantly in any modern browser and aims to provide a visceral, artistic perspective on market chaos, distinct from traditional trading tools.
The visualization connects directly to the public Binance trade stream via WebSocket, with an automatic fallback to Coinbase, ensuring uninterrupted data flow. Every market tick is visualized as a combatant—buy orders from the Cobalt Host push the front line from the left, while sell orders from the Ember Legion counter from the right. Large liquidations are represented as airstrikes, intensifying the battlefield aesthetic.
Built entirely with client-side web technologies, the system uses Canvas 2D graphics, WebAudio synthesis, and real-time stream processing, with a minimal footprint of roughly 180KB. Features include an automatic camera that shifts perspectives, a live DEFCON meter indicating volatility, and a scrolling war log narrating ongoing conflicts. A synthetic soundtrack generated within the browser heightens the immersive experience.
Importantly, the project states explicitly that it is not a trading tool—it does not involve wallets, signals, or trading advice. Instead, it offers an artistic, data-driven visualization of market activity, emphasizing the chaos and intensity of Bitcoin trading as a cinematic battlefield.
Implications of Visualizing Market Chaos as War
This project demonstrates how advanced web technologies can be harnessed for creative data visualization, offering a visceral, artistic interpretation of financial markets. It provides a new way for enthusiasts and observers to engage with market dynamics, emphasizing volatility and activity through a compelling visual narrative. While not a trading tool, it highlights the raw, chaotic nature of Bitcoin trading, potentially influencing how market data is perceived and understood.
Bitcoin trading visualization software
As an affiliate, we earn on qualifying purchases.
As an affiliate, we earn on qualifying purchases.
Background of Market Visualizations and Web Tech Innovation
Traditional market analysis relies on charts, indicators, and data feeds. This project, developed by isbitcoindead.com, pushes the boundaries by turning live trade data into an immersive cinematic experience. It builds on recent advances in browser-based graphics and real-time data processing, showcasing how web tech can create artistic representations of complex systems. The visualization aligns with a broader trend of using technology for creative and educational purposes in finance and data science.
“This visualization offers a visceral glimpse into market chaos, transforming raw data into an engaging narrative.”
— an anonymous researcher
Electronic Display for Real-Time Cryptocurrency/Bitcoin/Stock Market Data, Time, Weather & Temperature, 164*28*65mm, Supports Image Upload and 30s Video Playback, App-Controlled, 960*360 Resolution
Real-Time Data Display – Shows live cryptocurrency (Bitcoin), stock market trends, time, weather, and temperature updates at a…
As an affiliate, we earn on qualifying purchases.
As an affiliate, we earn on qualifying purchases.
Unclear Aspects of Data Accuracy and Future Development
It is not yet clear how accurately the visualization reflects real-time market activity or if it will incorporate additional features in the future. The project explicitly states it is not a trading tool, but the potential for expanded functionalities remains uncertain. Additionally, the impact of such visualizations on market perception or trading behavior is still to be studied.
live Bitcoin market monitor
As an affiliate, we earn on qualifying purchases.
As an affiliate, we earn on qualifying purchases.
Next Steps for the Visualization and User Engagement
The developers may update the visualization with new features or enhanced graphics. Observers and users can explore the current version at war.isbitcoindead.com. Further insights into the engineering or potential integrations with other data streams are likely to be announced. Monitoring user feedback and technological advancements will shape its future evolution.
Bitcoin trading art print
As an affiliate, we earn on qualifying purchases.
As an affiliate, we earn on qualifying purchases.
Key Questions
Is this visualization a trading tool?
No, it is not designed for trading or providing investment advice. It is an artistic visualization of market activity.
How does the visualization connect to live market data?
It connects directly to Binance’s public trade stream via WebSocket, with a fallback to Coinbase, ensuring real-time updates.
Can I customize or interact with the visualization?
The current version offers automatic camera shifts and a fixed interface. Customization options are not yet specified but may be introduced in future updates.
Does this visualization impact market trading?
There is no evidence that it influences trading decisions; it is purely a visual and artistic representation.
Is the visualization available for free?
Yes, it is accessible at no cost in any modern web browser.
Source: ThorstenMeyerAI.com